

Glacier launches DataMap to help MRF operators reduce downtime with real-time data
New AI-powered platform gives recycling facility supervisors greater visibility into equipment performance, material flow, and operational issues
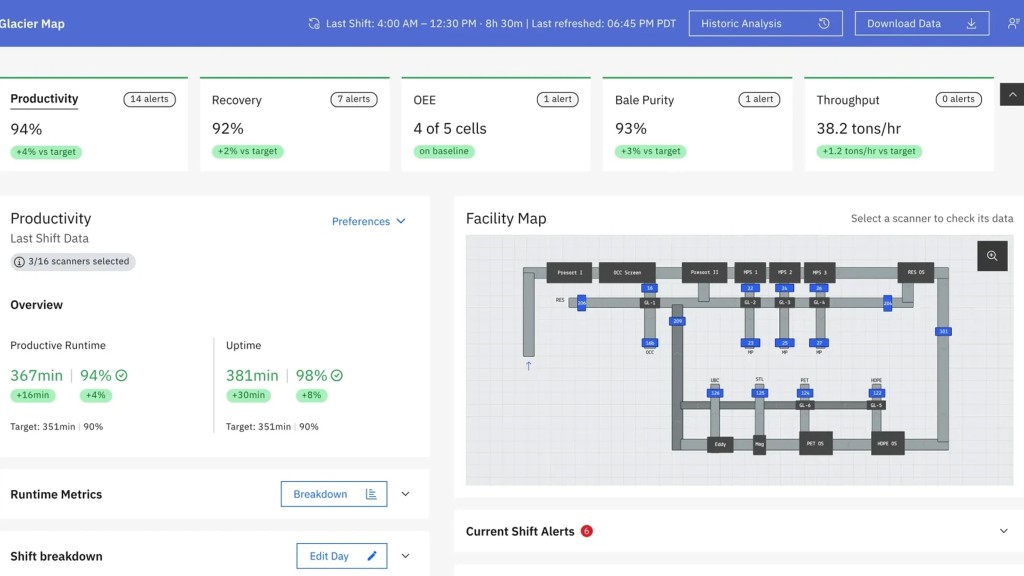
Glacier, the AI robotics company backed by Amazon's Climate Pledge Fund, has introduced DataMap. This new tool is built to answer the questions recycling facility operators ask every shift: Where are we losing time? What systems aren't performing as expected? Did the fix actually work? DataMap gives supervisors a real-time view of uptime, productive run time, empty belts, and material flow.
Glacier developed DataMap in close collaboration with operators across the U.S., including Recology's Recycle Central facility at Pier 96 in San Francisco, which processes nearly 500 tons of material daily. Early results include:
- Nearly 30 minutes of productive run time recovered per shift
- Supervisors documenting 92 of operational issues identified by DataMap, creating greater visibility into downtime and its causes
- Daily adoption by facility supervisors, making DataMap part of regular shift management
AI-powered scanners installed throughout the materials recovery facility continuously watch material flow and equipment activity. DataMap turns that information into actionable insights for supervisors on the floor, showing when belts have stopped moving or are running empty, where equipment isn't performing as expected, and which issues need immediate attention.
That visibility extends beyond the control room. Supervisors and managers can access DataMap from a computer, tablet, or phone to monitor operations wherever they are. They can also review shift history to determine whether an adjustment, repair, or operating change improved performance.
Real-time visibility into MRF operations
On the MRF floor, everyone sees a piece of the operation. The challenge is giving the whole team the same picture while there is still time to act. A supervisor may catch one issue while maintenance is responding to another. Day shift and swing shift may have different explanations for the same performance problem. By the time leadership reviews the numbers, the moment to act may be long gone.
DataMap gives the team one shared view of facility performance. Real-time alerts flag downtime, empty belts, residue leakage, and other operating issues. Facility maps show where they are happening. Line images give supervisors immediate context. Shift history shows what changed, when it changed, and how long it lasted.
DataMap helps Recycle Central reduce downtime
At Recology's Recycle Central San Francisco facility, consistent performance across every shift is critical.
DataMap is already becoming part of the facility's daily operating rhythm. Supervisors have logged into DataMap during every shift since launch, with shift leads spending approximately 70 minutes per shift in the product and other supervisors averaging roughly 30 minutes per shift.
Recycle Central supervisors use DataMap to guide operating decisions, from testing assumptions about equipment settings across day and swing shifts to identifying downtime and empty-belt events earlier. Day and swing shift teams now receive the same shift data and see which settings are associated with more consistent performance.
By identifying, reporting and addressing operating issues faster, the Recycle Central team has reduced empty-belt time and downtime, and according to Glacier, recovered an average of nearly 30 minutes of productive run time per shift.
DataMap is also creating a more complete record of every shift. Today, users are proactively submitting detailed notes on 92 percent of operational issues identified by DataMap. This gives frontline operators and their leadership teams a clearer picture of what went wrong and what was done about it.
For the Recycle Central team, the goal is sustained performance, shift after shift. Maintaining uptime above 90 percent is an important benchmark, and DataMap gives supervisors a clearer way to confirm that the MRF is consistently achieving its uptime goals and what is getting in the way when it does not.
Helping MRF operators make data-driven decisions
DataMap was designed around a simple idea: the data is only useful if the team can act on it.
"When we built DataMap, it was really important that there was no mystery behind the data. We wanted operators to be able to see what's happening in real time and understand why the data says what it says, so they trust it enough to act," said Anisa Nuanes, Head of Product at Glacier. "Data is only useful if it helps the people running the facility make a decision or take action. Otherwise, what's the point of another dashboard?"
Glacier says that is also what differentiates DataMap from traditional reporting tools. Instead of starting with dashboards and asking operators to make sense of them, it is built around the questions MRF teams actually ask during a shift and what MRF managers need to know at a glance: Where did we lose time? Why did the line stop? Are we running consistently? Did that adjustment actually help?
"MRF operators don't need more spreadsheets and charts," said Rebecca Hu-Thrams, co-founder and CEO of Glacier. "They need direct answers to the questions that determine whether they have a good shift or a bad one. We built DataMap to answer those questions."
DataMap is currently deployed with select MRF partners across the country, with additional facilities coming online soon. Glacier is expanding the program to MRF operators looking for a clearer, real-time view of facility performance.

