Plastics possibilities -- using data and diversion metrics to enhance sustainability through increased recovery

As a dynamic, member-driven organization dedicated to the growth of plastics businesses in North America, the Canadian Plastics Industry Association (CPIA) operates a post-use resource recovery program with two objectives.
1.) Work collaboratively with stakeholders to improve the sustainability of plastics; and,
2.) Increase the types and volumes of plastics diverted from landfill, through recycling and energy recovery options.
These objectives are accomplished through a variety of initiatives and projects, including the research and diversion metrics outlined in the three research reports noted below.
Access to recycling report
In February 2015, CPIA released its “2014 Recycling Access Report for Plastic Containers and Packaging” which shows that recycling programs have become a regular part of daily life for the majority of Canadians, and the number of recycling programs that now accept and recycle a wide range of plastic packaging has grown to its largest ever in 10 years.
While access to recycling of plastic beverage containers continues to hold steady at 98 percent or more, the report found that the biggest gains have been realized for non-bottle rigid containers made from a variety of resin types. The national rate for access to recycling of plastic non-bottle containers is at least 93 percent for the most common resin types of PET and HDPE (also known by resin identification codes #1 and #2 respectively). For non-bottle containers made from other resin types, such as PVC, LDPE and PP (#3, #4 and #5 respectively) recycling access rates are greater than 80 percent. For non-container plastic packaging, there have been steady gains in the national and provincial access rates with more and more municipal recycling programs beginning to include these items in their systems. Of note, the latest access for municipal recycling of retail shopping bags is 67 percent and horticultural rigid plastics is 74 percent.
The annual recycling access report provides valuable information on a national scale with specific details of each province’s plastic container and non-container recycling access rates.
National recycling rates
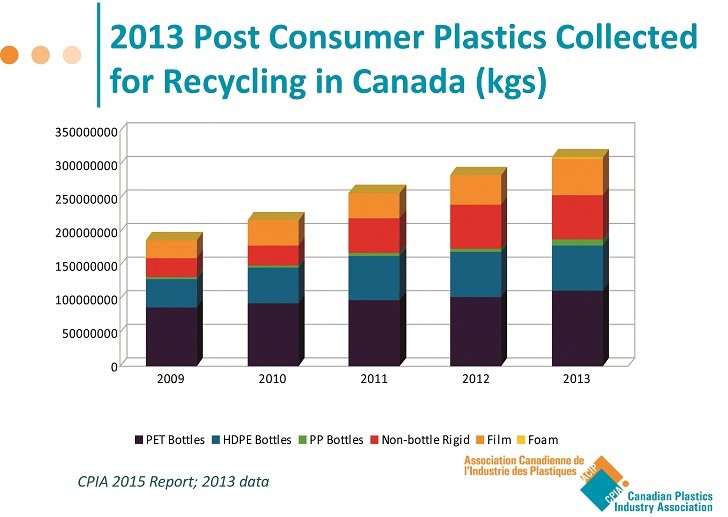
Another area that CPIA documents on an annual basis is the national recycling rate. In April 2015, CPIA released the “2013 Postconsumer Plastics Recycling in Canada” report informing Canadians that their recycling efforts have increased the amount of post-consumer plastic packaging being recycled across Canada. An additional nine percent of plastic packaging was recycled in 2013, compared to 2012, as reported by Moore Recycling Associates Inc. This increase is the result of more material collected for recycling as well as more companies providing recycling information. In total, over 311 million kilograms of post-consumer plastic packaging were collected in Canada for recycling in 2013 (see chart above). The results are derived from a voluntary survey of more than 500 companies that handle recycled plastics in North America. These companies are made up of reclaimers, exporters, brokers, MRFs and other handlers of used plastics. This year’s data, along with that of previous years, also consistently indicates that material collected in Canada routinely remains in North America rather than moving to overseas markets. The reported quantities of plastic recycled in 2013, compared to 2012, represents an increase of 13 million kilograms for bottles and an increase of 10 million kilograms for plastic film, such as bags and outer wrap. Of particular note, there was a 23 percent increase in plastic film and bags recycling, which can be attributed to both an increase in collection and strengthened participation in the survey.
Life cycle analysis of packaging
In March 2014, CPIA along with the American Chemistry Council commissioned a study called “Impact of Plastics Packaging on Life Cycle Energy Consumption & Greenhouse Gas Emissions in the United States and Canada.” This study determined that six major categories of plastic packaging help to significantly reduce energy use and greenhouse gas emissions compared to packaging alternatives made with other materials. The study provides a transparent, detailed life cycle assessment that quantifies the energy and climate benefits of using various types of everyday plastic packaging compared to alternatives, and assesses the energy requirements and greenhouse gas emissions of six general categories of plastic packaging produced and sold in the United States and Canada. These include caps and closures, beverage containers, other rigid containers, carrier (or shopping) bags, stretch/shrink wrap, and other flexible packaging. The study authors (from Franklin Associates) used life cycle assessment (LCA) methodology to compare current amounts of various plastic packaging products to packaging made with alternative materials. The assessment found that for the baseline year (2010) replacing all plastic packaging with non-plastic alternatives for these six types of packaging in Canada would require almost 4.4 times as much packaging material by weight, increasing the amount of packaging used in Canada by nearly 5.5 million tonnes or 5.5 billion kilograms. It would also increase energy use by 2.0 times and result in 2.3 times more global warming potential.
As part of CPIA’s ongoing efforts to increase the diversion of plastics packaging from landfills across Canada, we know that up-to-date data is critical to bringing focus and context to the current situation. As such, CPIA will continue to develop metrics to establish baseline data and to measure the progress of diversion projects across Canada.
All of the reports mentioned in this article are available at www.plastics.ca.
Company info
5955 Airport Road, Suite 125
Mississauga, ON
CA, L4V 1R9
Website:
plastics.ca/home/index.php


